-
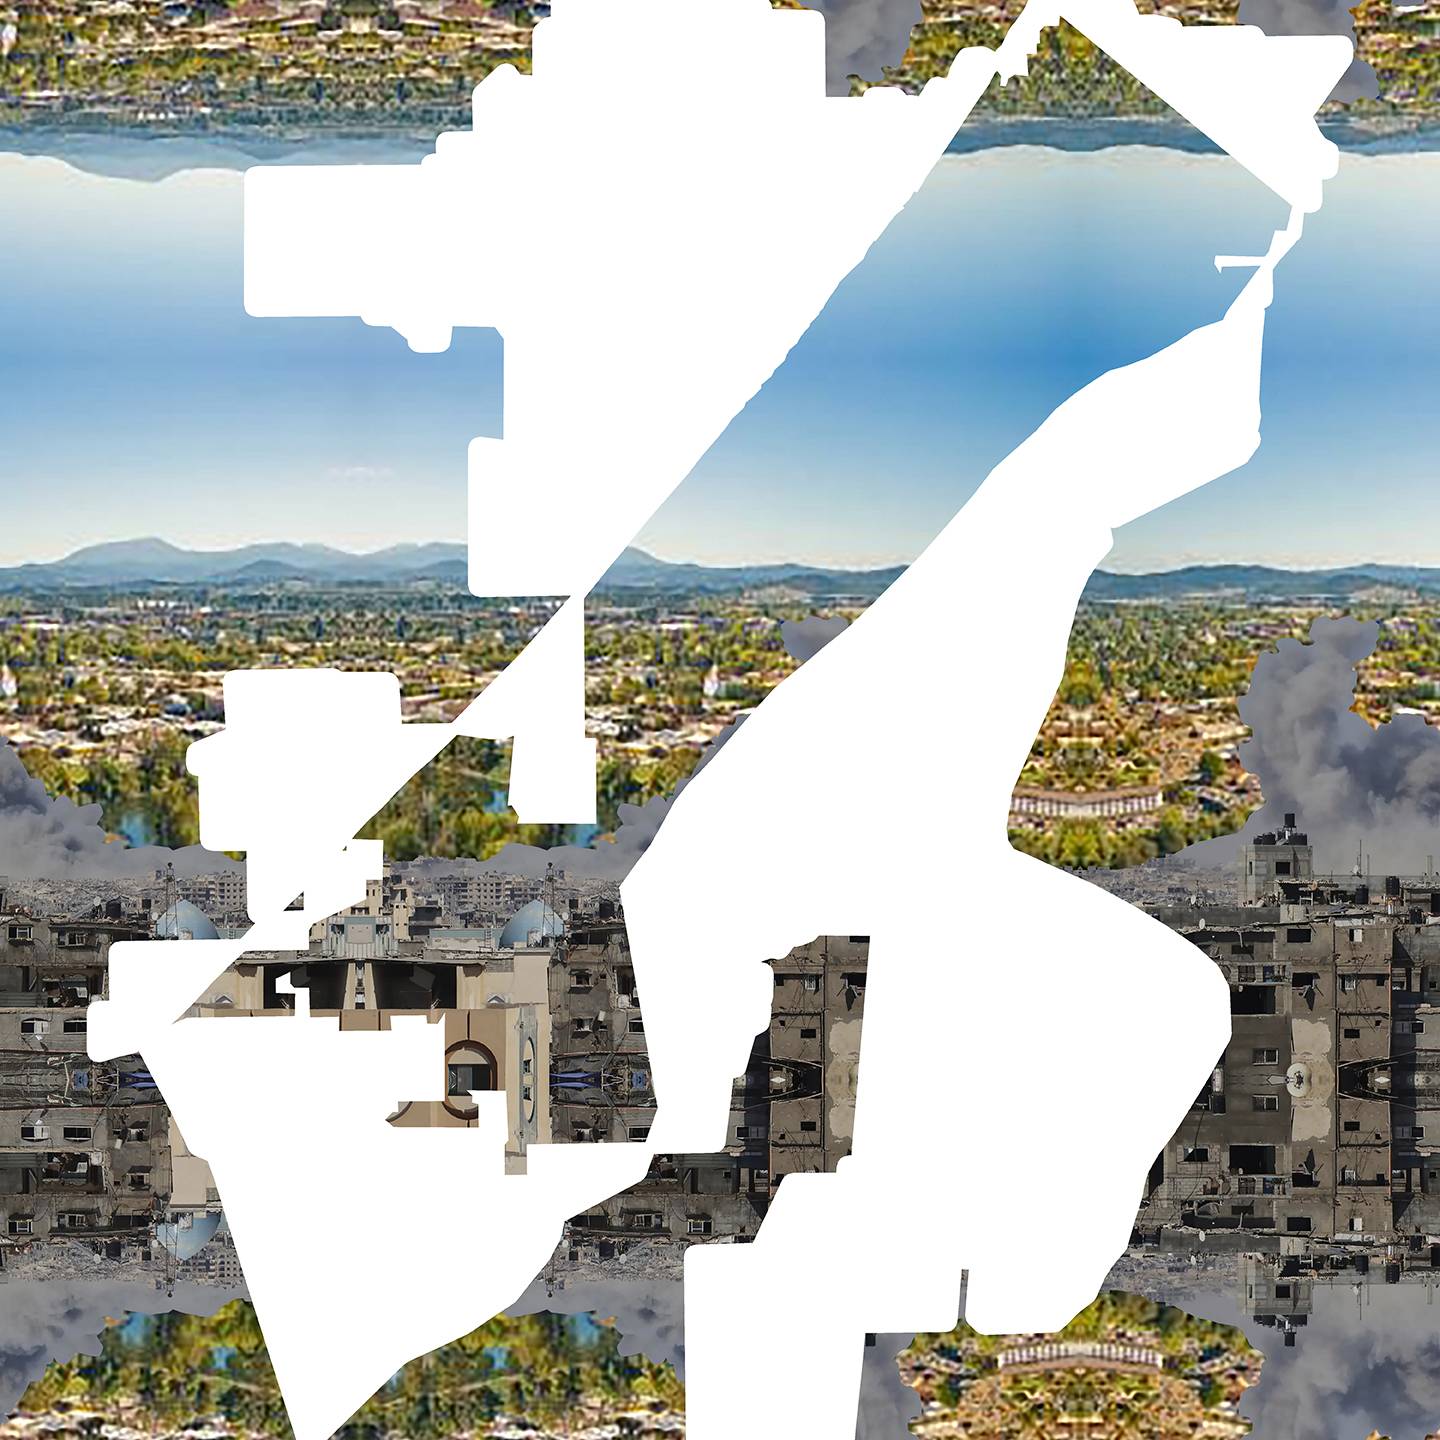
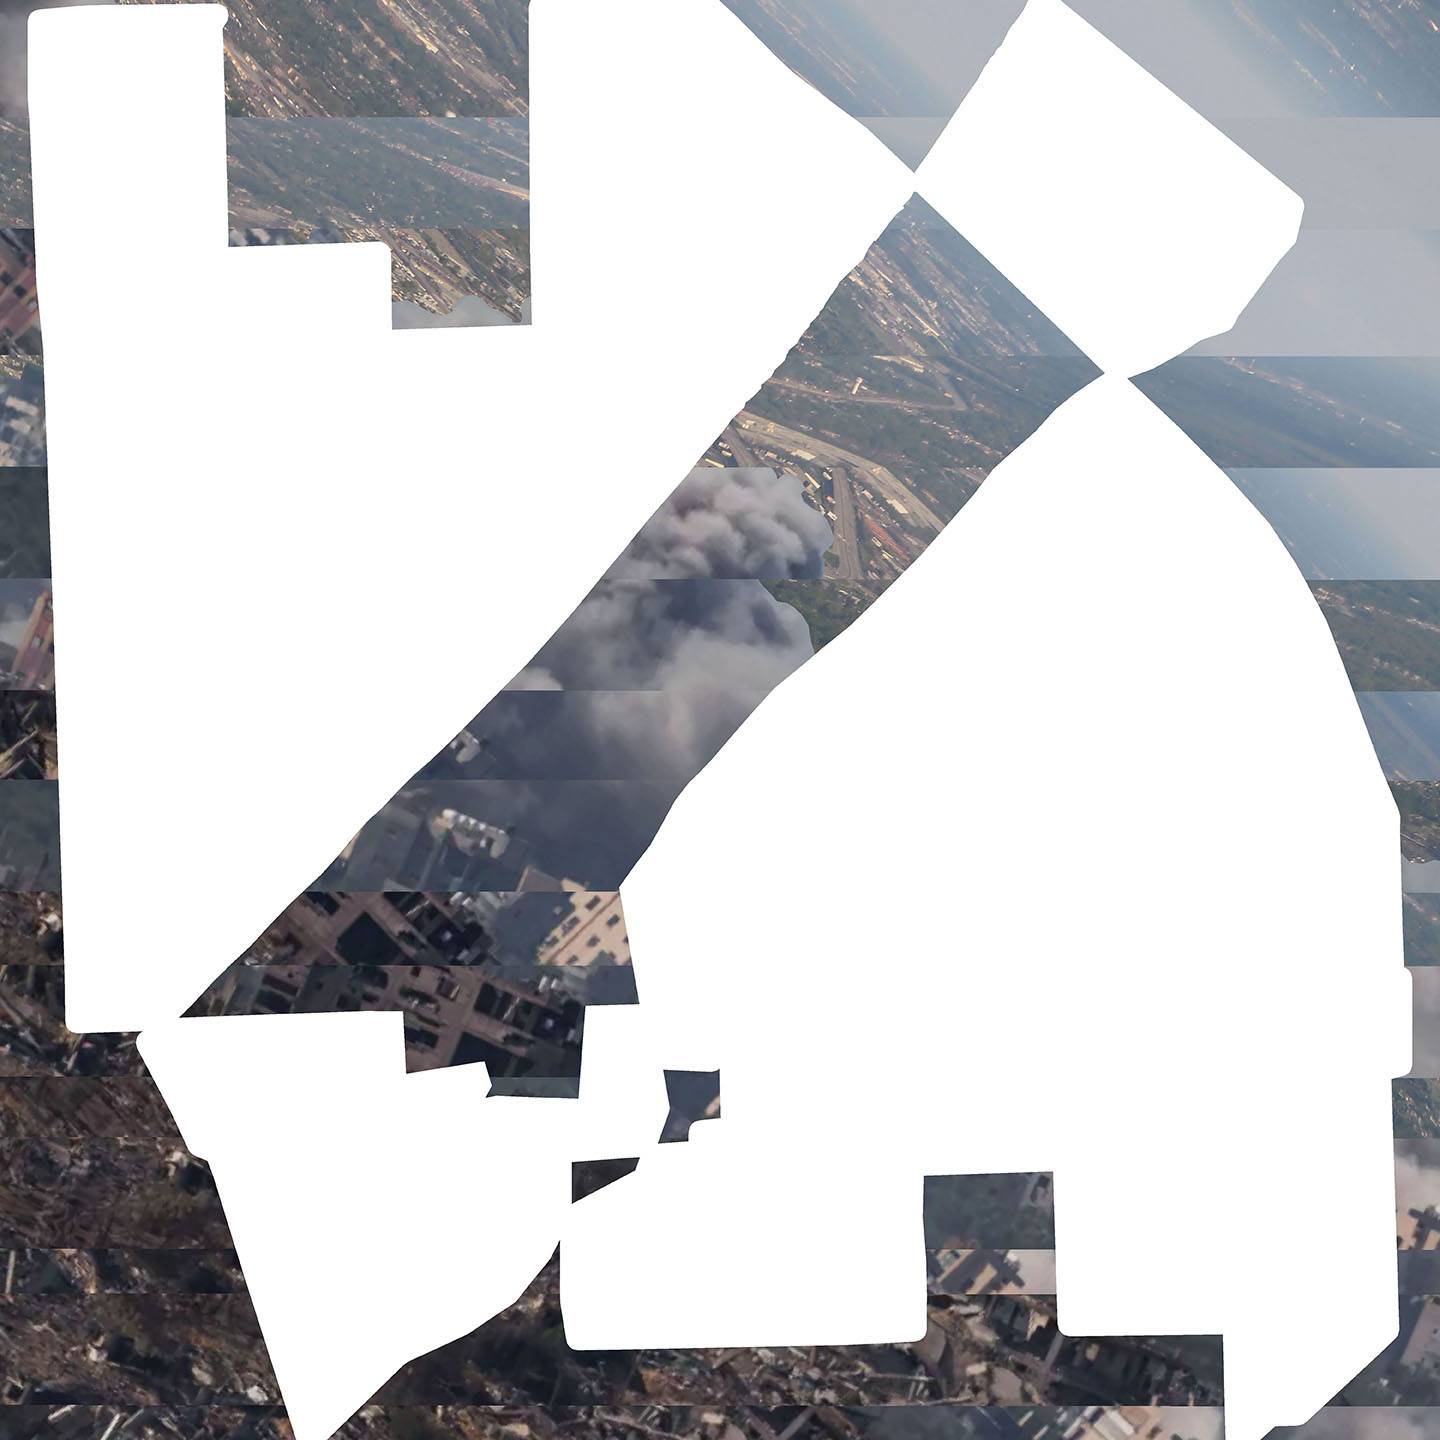
February 7, 2026 / 72,027 Dead Bodies in Gaza / 71,999 Live Bodies in Mount Vernon, New York
20 inches by 20 inches
Digital Collage
2026
-
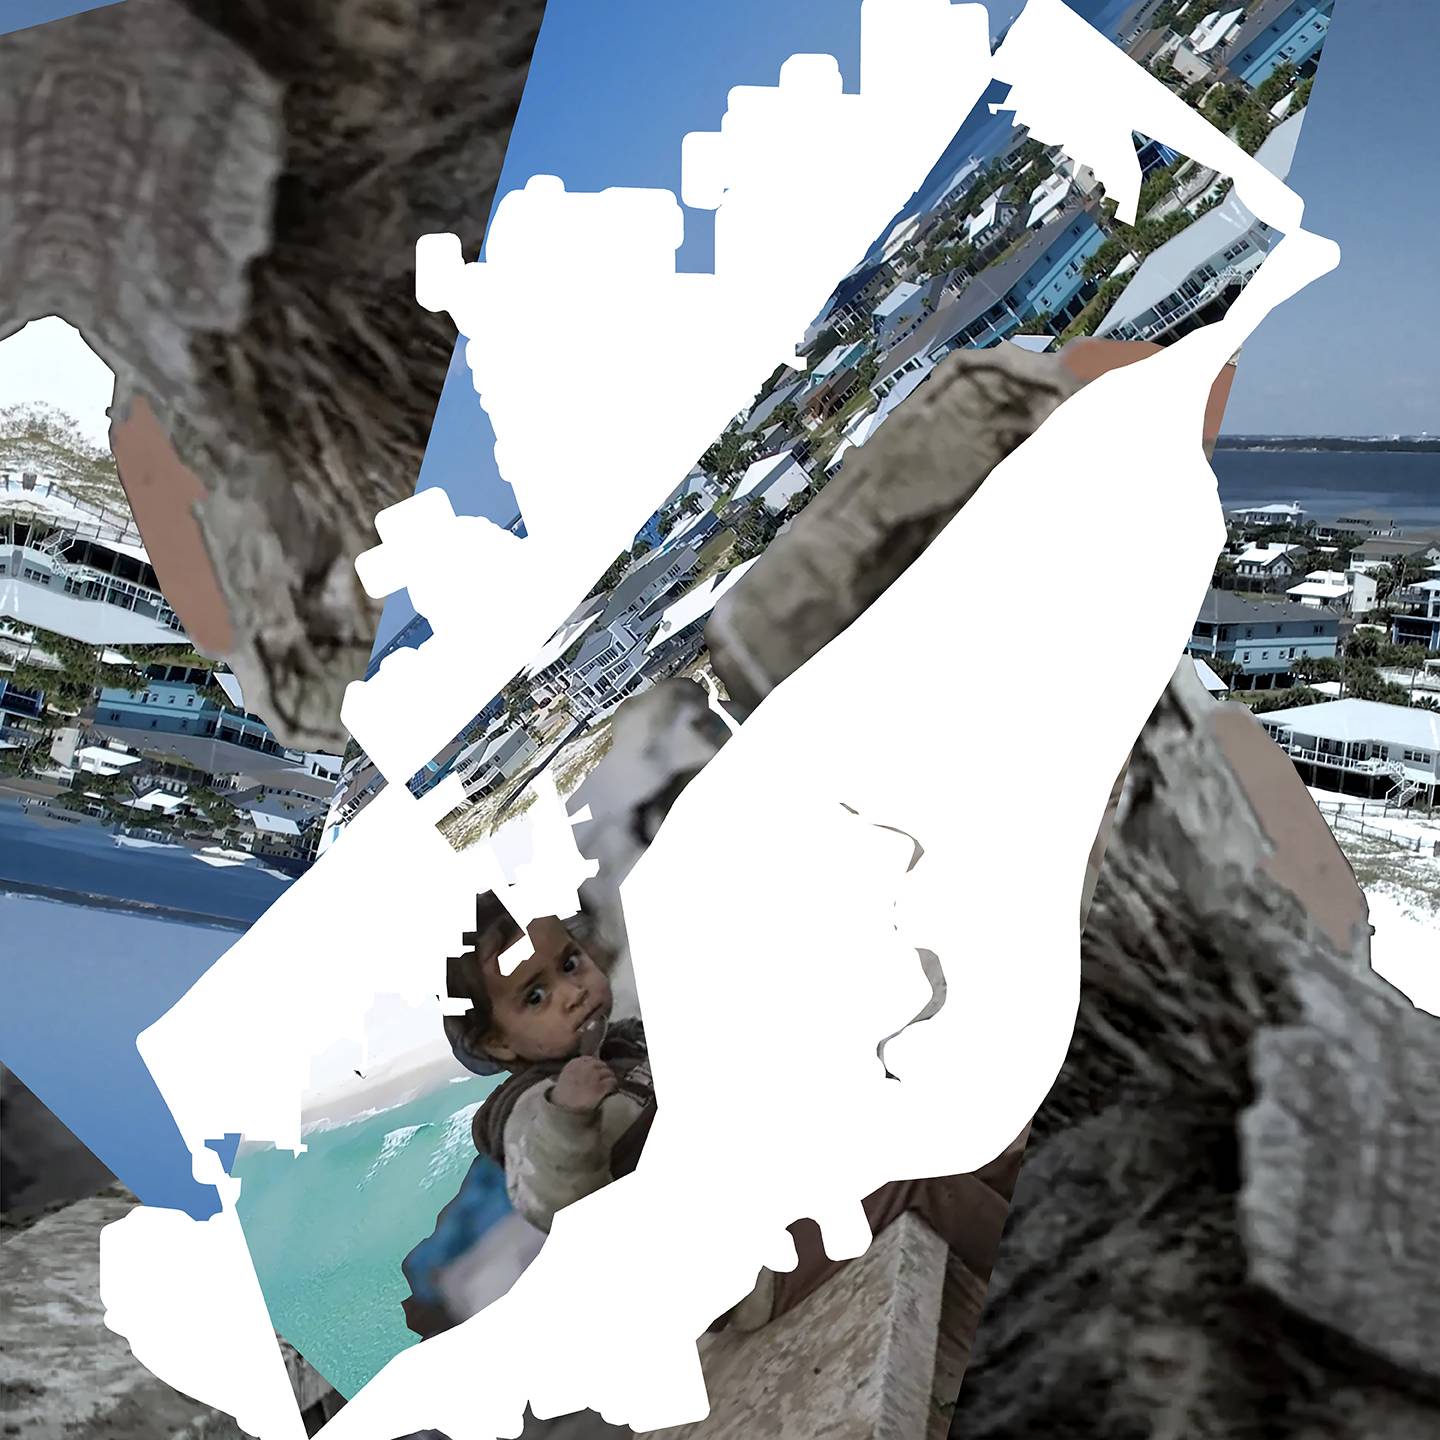
December 27, 2025 / 71,266 Dead Bodies in Gaza / 71,098 Live Bodies in Saint Joseph, Missouri
20 inches by 20 inches
Digital Collage
2025
-
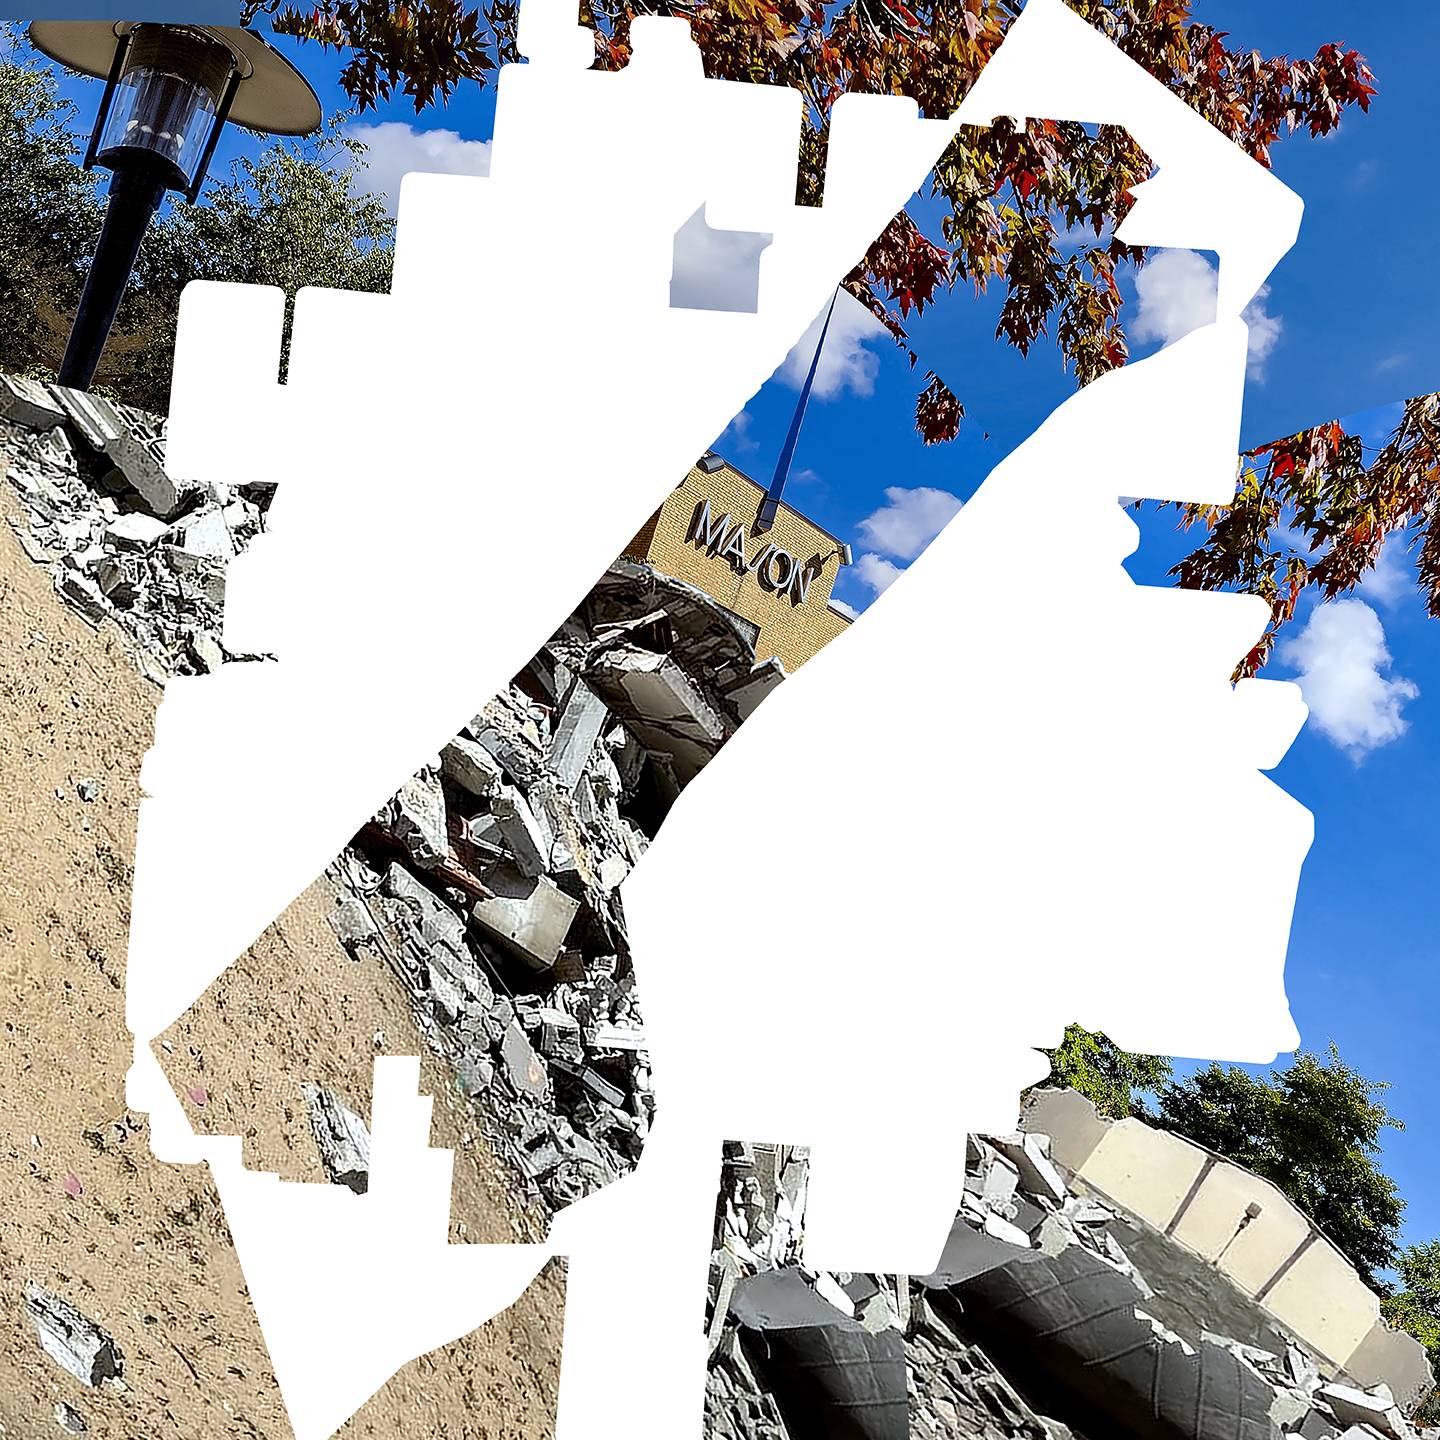
November 29, 2025 / 70,100 Dead Bodies in Gaza / 69,881 Live Bodies in Camarillo, California
20 inches by 20 inches
Digital Collage
2025
-
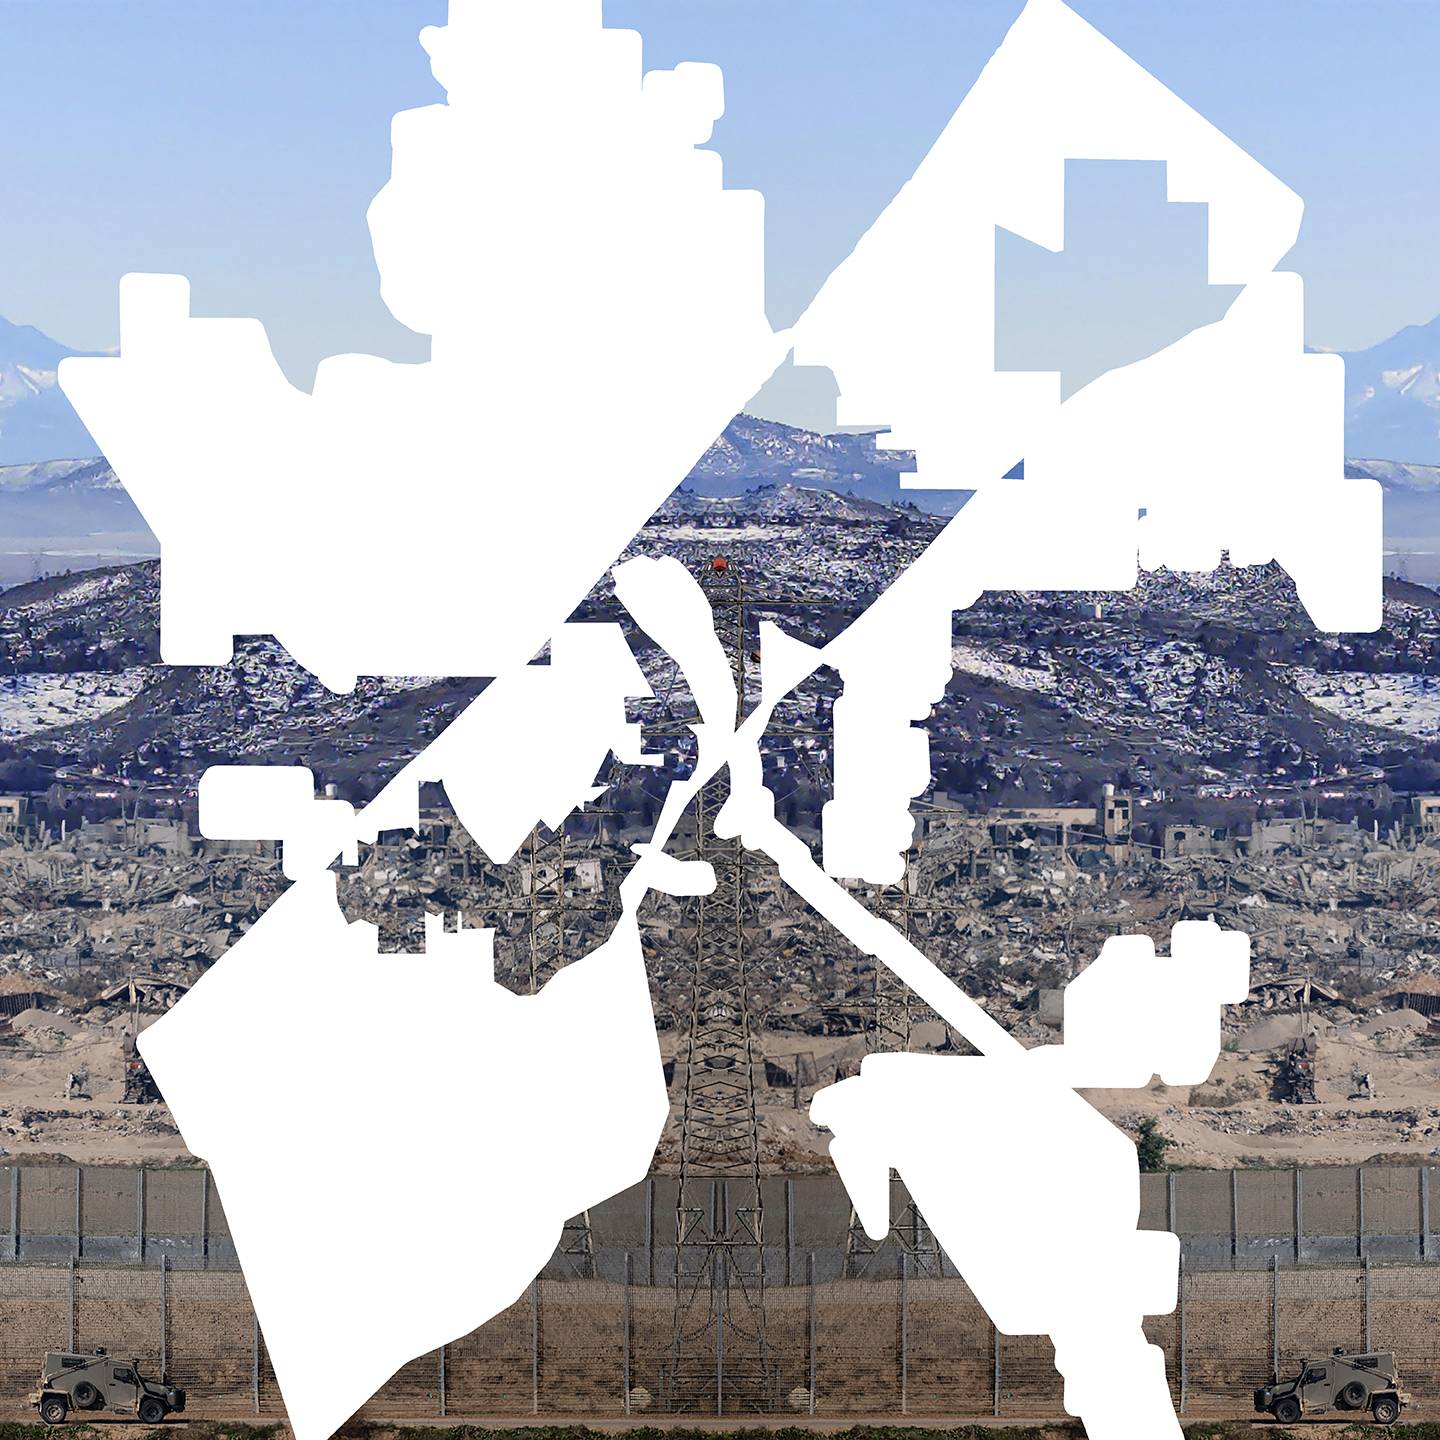
November 8, 2025 / 69,169 Dead Bodies in Gaza / 69,148 Live Bodies in Yuba City, California
20 inches by 20 inches
Digital Collage
2025
-
October 18, 2025 / 68,116 Dead Bodies in Gaza / 68,075 Live Bodies in Redondo Beach, California
20 inches by 20 inches
Digital Collage
2025
-
October 4, 2025 / 67,074 Dead Bodies in Gaza / 66,919 Live Bodies in Sanford, Florida
20 inches by 20 inches
Digital Collage
2025
-
September 28, 2025 / 66,005 Dead Bodies in Gaza / 65,849 Live Bodies in Waltham, Massachusetts
20 inches by 20 inches
Digital Collage
2025
-
September 17, 2025 / 65,062 Dead Bodies in Gaza / 64,864 Live Bodies in Burnsville, Minnesota
20 inches by 20 inches
Digital Collage
2025
-
September 4, 2025 / 64,231 Dead Bodies in Gaza / 64,217 Live Bodies in Millcreek, Utah
20 inches by 20 inches
Digital Collage
2025
-
August 29, 2025 / 63,025 Dead Bodies in Gaza / 62,994 Live Bodies in Westfield, Indiana
20 inches by 20 inches
Digital Collage
2025
-
August 18, 2025 / 62,004 Dead Bodies in Gaza / 61,993 Live Bodies in Corvallis, Oregon
20 inches by 20 inches
Digital Collage
2025
-
August 5, 2025 / 61,020 Dead Bodies in Gaza / 61,015 Live Bodies in Stonecrest, Georgia
20 inches by 20 inches
Digital Collage
2025
-
July 29, 2025 / 63,025 Dead Bodies in Gaza / 60,013 Live Bodies in Great Falls, Montana
20 inches by 20 inches
Digital Collage
2025
-
July 21, 2025 / 59,029 Dead Bodies in Gaza / 58,987 Live Bodies in Dubuque, Iowa
20 inches by 20 inches
Digital Collage
2025
-
July 13, 2025 / 58,026 Dead Bodies in Gaza / 57,996 Live Bodies in Monterey Park, California
20 inches by 20 inches
Digital Collage
2025
-
July 2, 2025 / 57,012 Dead Bodies in Gaza / 56,939 Live Bodies in Perth Amboy, New Jersey
20 inches by 20 inches
Digital Collage
2025
-
June 24, 2025 / 56,077 Dead Bodies in Gaza / 56,036 Live Bodies in Fountain Valley, California
20 inches by 20 inches
Digital Collage
2025
-
June 11, 2025 / 55,104 Dead Bodies in Gaza / 54,768 Live Bodies in Kentwood, Michigan
20 inches by 20 inches
Digital Collage
2025
-
May 27, 2025 / 54,056 Dead Bodies in Gaza / 53,898 Live Bodies in Pensacola, Florida
20 inches by 20 inches
Digital Collage
2025
-
May 15, 2025 / 53,010 Dead Bodies in Gaza / 52,912 Live Bodies in Jeffersonville, Indiana
20 inches by 20 inches
Digital Collage
2025
-
April 27, 2025 / 52,243 Dead Bodies in Gaza / 52,205 Live Bodies in Battle Creek, Michigan
20 inches by 20 inches
Digital Collage
2025
-
April 15, 2025 / 51,000 Dead Bodies in Gaza / 50,979 Live Bodies in Cuyahoga Falls, Ohio
20 inches by 20 inches
Digital Collage
2025
-
March 23, 2025 / 50,021 Dead Bodies in Gaza / 49,975 Live Bodies in Portage, Michigan
20 inches by 20 inches
Digital Collage
2025
-
March 18, 2025 / 49,013 Dead Bodies in Gaza / 48,964 Live Bodies in East Lansing, Michigan
20 inches by 20 inches
Digital Collage
2025
-
February 8, 2025 / 48,181 Dead Bodies in Gaza / 48,144 Live Bodies in Biloxi, Mississippi
20 inches by 20 inches
Digital Collage
2025
-
January 20, 2025 / 47,035 Dead Bodies in Gaza / 46,851 Live Bodies in Cerritos, California
20 inches by 20 inches
Digital Collage
2025
-
January 9, 2025 / 46,006 Dead Bodies in Gaza / 45,952 Live Bodies in Morgan Hill, California
20 inches by 20 inches
Digital Collage
2025
-
December 16, 2024 / 45,028 Dead Bodies in Gaza / 45,024 Live Bodies in Bountiful, Utah
20 inches by 20 inches
Digital Collage
2025
-
November 21, 2024 / 44,056 Dead Bodies in Gaza / 44,019 Live Bodies in Grove City, Ohio
20 inches by 20 inches
Digital Collage
2025
-
October 28, 2024 / 43,020 Dead Bodies in Gaza / 43,001 Live Bodies in Saginaw, Michigan
20 inches by 20 inches
Digital Collage
2025
-
October 9, 2024 / 42,010 Dead Bodies in Gaza / 41,993 Live Bodies in Danville, Virginia
20 inches by 20 inches
Digital Collage
2025
-
September 10, 2024 / 41,020 Dead Bodies in Gaza / 40,989 Live Bodies in Amherst, Massachusetts
20 inches by 20 inches
Digital Collage
2025
-
August 15, 2024 / 40,005 Dead Bodies in Gaza / 39,993 Live Bodies in Norwich, Connecticut
20 inches by 20 inches
Digital Collage
2025
-
July 22, 2024 / 39,006 Dead Bodies in Gaza / 38,999 Live Bodies in Syracuse, Utah
20 inches by 20 inches
Digital Collage
2025
-
July 4, 2024 / 38,011 Dead Bodies in Gaza / 37,971 Live Bodies in Hot Springs, Arkansas
20 inches by 20 inches
Digital Collage
2025
-
June 9, 2024 / 37,084 Dead Bodies in Gaza / 37,056 Live Bodies in Pacifica, California
20 inches by 20 inches
Digital Collage
2025
-
May 27, 2024 / 36,050 Dead Bodies in Gaza / 36,046 Live Bodies in Mason, Ohio
20 inches by 20 inches
Digital Collage
2025
-
May 12, 2024 / 35,034 Dead Bodies in Gaza / 35,023 Live Bodies in Holland, Michigan
20 inches by 20 inches
Digital Collage
2025
-
April 19, 2024 / 34,012 Dead Bodies in Gaza / 33,943 Live Bodies in Eastpointe, Michigan
20 inches by 20 inches
Digital Collage
2025
-
April 4, 2024 / 33,037 Dead Bodies in Gaza / 33,008 Live Bodies in Sachse, Texas
20 inches by 20 inches
Digital Collage
2025
-
March 22, 2024 / 32,070 Dead Bodies in Gaza / 31,999 Live Bodies in Carlsbad, New Mexico
20 inches by 20 inches
Digital Collage
2025
-
March 10, 2024 / 31,045 Dead Bodies in Gaza / 31,036 Live Bodies in Ballwin, Missouri
20 inches by 20 inches
Digital Collage
2025
-
February 29, 2024 / 30,035 Dead Bodies in Gaza / 29,992 Live Bodies in Fredericksburg, Virginia
20 inches by 20 inches
Digital Collage
2025
-
February 19, 2024 / 29,092 Dead Bodies in Gaza / 29,081 Live Bodies in Southgate, Michigan
20 inches by 20 inches
Digital Collage
2025
-
February 10, 2024 / 28,064 Dead Bodies in Gaza / 28,043 Live Bodies in Foley, Alabama
20 inches by 20 inches
Digital Collage
2025
-
February 1, 2024 / 27,019 Dead Bodies in Gaza / 27,015 Live Bodies in Greenville, Mississippi
20 inches by 20 inches
Digital Collage
2025
-
January 26, 2024 / 26,083 Dead Bodies in Gaza / 26,067 Live Bodies in Xenia, Ohio
20 inches by 20 inches
Digital Collage
2025
-
January 21, 2024 / 25,105 Dead Bodies in Gaza / 25,082 Live Bodies in Cartersville, Georgia
20 inches by 20 inches
Digital Collage
2025
-
January 15, 2024 / 24,100 Dead Bodies in Gaza / 24,038 Live Bodies in Watertown, New York
20 inches by 20 inches
Digital Collage
2025
-
January 8, 2024 / 23,084 Dead Bodies in Gaza / 23,081 Live Bodies in Maple Heights, Ohio
20 inches by 20 inches
Digital Collage
2025
-
January 2, 2024 / 22,185 Dead Bodies in Gaza / 22,174 Live Bodies in Klamath Falls, Oregon
20 inches by 20 inches
Digital Collage
2025
-
December 27, 2023 / 21,110 Dead Bodies in Gaza / 21,109 Live Bodies in Murphy, Texas
20 inches by 20 inches
Digital Collage
2025
-
December 22, 2023 / 20,057 Dead Bodies in Gaza / 20,041 Live Bodies in El Reno, Oklahoma
20 inches by 20 inches
Digital Collage
2025
-
December 18, 2023 / 19,453 Dead Bodies in Gaza / 19,439 Live Bodies in Albany, California
20 inches by 20 inches
Digital Collage
2025
-
December 11, 2023 / 18,205 Dead Bodies in Gaza / 18,185 Live Bodies in Sunland Park, New Mexico
20 inches by 20 inches
Digital Collage
2025
-
December 7, 2023 / 17,177 Dead Bodies in Gaza / 17,172 Live Bodies in Norwalk, Ohio
20 inches by 20 inches
Digital Collage
2025
-
December 5, 2023 / 16,248 Dead Bodies in Gaza / 16,238 Live Bodies in Mount Pleasant, Texas
20 inches by 20 inches
Digital Collage
2025
-
December 2, 2023 / 15,207 Dead Bodies in Gaza / 15,187 Live Bodies in Menasha, Wisconsin
20 inches by 20 inches
Digital Collage
2025
-
November 21, 2023 / 14,128 Dead Bodies in Gaza / 14,118 Live Bodies in Hickory Hills, Illinois
20 inches by 20 inches
Digital Collage
2025
-
November 19, 2023 / 13,000 Dead Bodies in Gaza / 12,990 Live Bodies in Sandy, Oregon
20 inches by 20 inches
Digital Collage
2025
-
November 17, 2023 / 12,000 Dead Bodies in Gaza / 11,984 Live Bodies in Liberty Hill, Texas
20 inches by 20 inches
Digital Collage
2025
-
November 10, 2023 / 11,078 Dead Bodies in Gaza / 11,077 Live Bodies in Fife, Washington
20 inches by 20 inches
Digital Collage
2025
-
November 6, 2023 / 10,022 Dead Bodies in Gaza / 10,014 Live Bodies in Cape Canaveral, Florida
20 inches by 20 inches
Digital Collage
2025
-
November 2, 2023 / 9,061 Dead Bodies in Gaza / 9,055 Live Bodies in Delavan, Wisconsin
20 inches by 20 inches
Digital Collage
2025
-
October 29, 2023 / 8,005 Dead Bodies in Gaza / 8,003 Live Bodies in Silvis, Illinois
20 inches by 20 inches
Digital Collage
2025
-
October 26, 2023 / 7,028 Dead Bodies in Gaza / 7,028 Live Bodies in LaFayette, Georgia
20 inches by 20 inches
Digital Collage
2025
-
October 25, 2023 / 6,547 Dead Bodies in Gaza / 6,547 Live Bodies in Orange City, Iowa
20 inches by 20 inches
Digital Collage
2025
-
October 23, 2023 / 5,087 Dead Bodies in Gaza / 5,084 Live Bodies in Bolivar, Tennessee
20 inches by 20 inches
Digital Collage
2025
-
October 20, 2023 / 4,137 Dead Bodies in Gaza / 4,136 Live Bodies in Hohenwald, Tennessee
20 inches by 20 inches
Digital Collage
2025
-
October 17, 2023 / 3,000 Dead Bodies in Gaza / 2,999 Live Bodies in Bicknell, Indiana
20 inches by 20 inches
Digital Collage
2025
-
October 14, 2023 / 2,228 Dead Bodies in Gaza / 2,228 Live Bodies in River Heights, Utah
20 inches by 20 inches
Digital Collage
2025
-
October 11, 2023 / 1,100 Dead Bodies in Gaza / 1,100 Live Bodies in Calmar, Iowa
20 inches by 20 inches
Digital Collage
2025